Turn your data into action
Utilize healthcare reporting and analytics tools designed to optimize HR operations, workforce performance, and care quality

Trusted by over 3,000 providers


Is your HR & payroll system built for healthcare?
Analytics built for healthcare
Workforce performance
See exactly how your teams perform, where they excel, and what needs attention
Data visualization
Transform complex healthcare data into insights that guide better decisions
Compliance confidence
Face audits knowing your reporting tells the complete story
Your reports, your way
Shape reports to fit the unique needs of your organization
Connect data, drive success
Link healthcare reporting with payroll, scheduling, and HR tools in one unified platform designed to optimize your operations
Every data point tells a story

Features
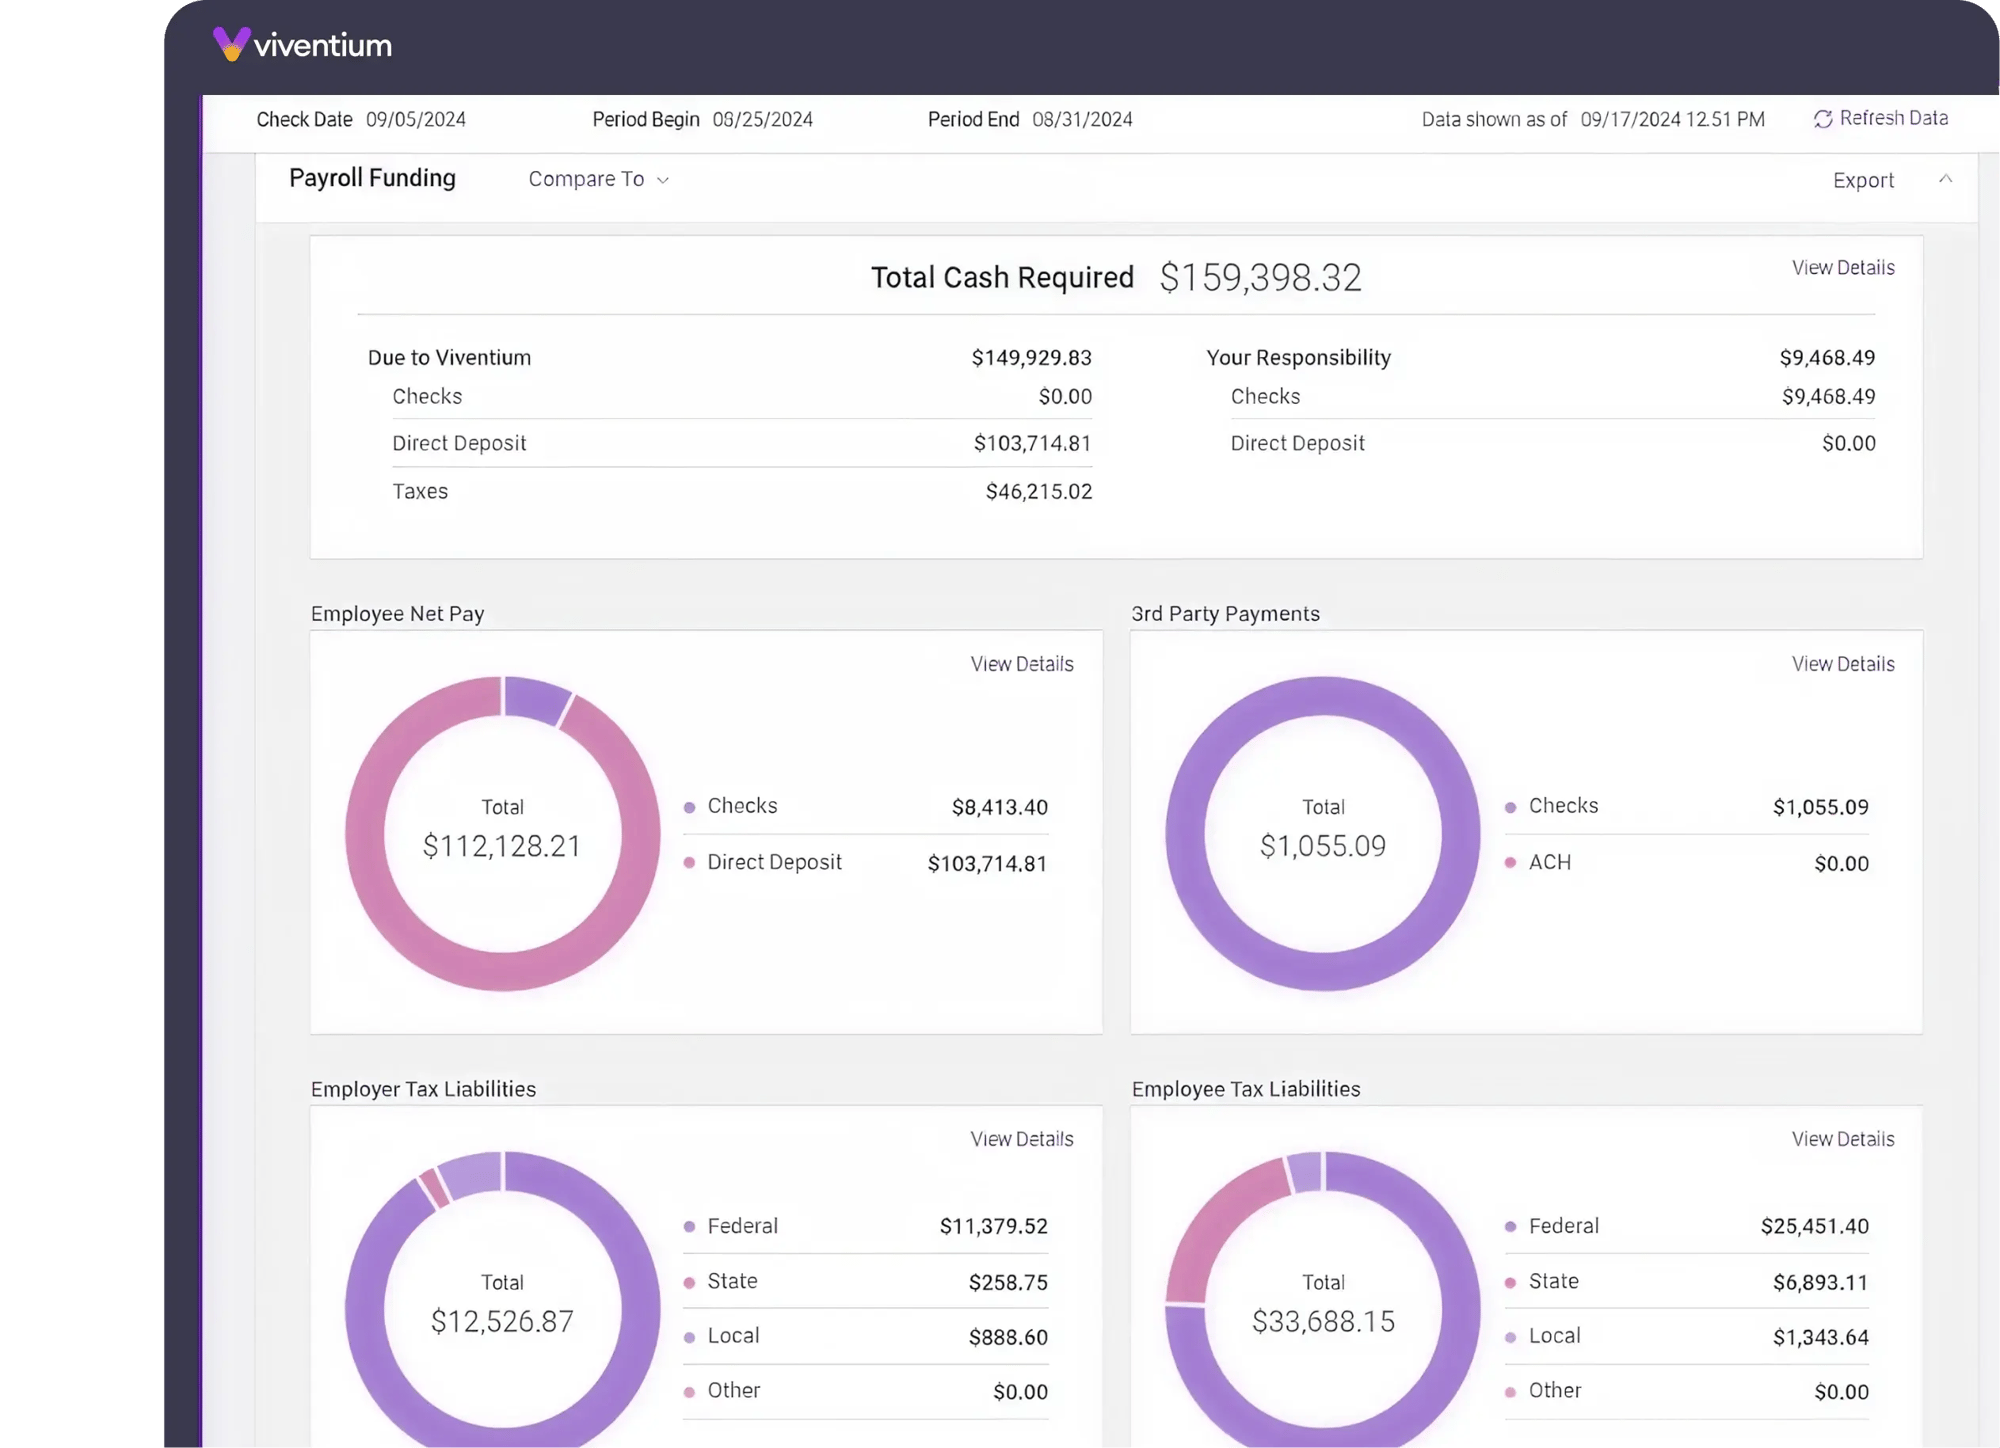
Spot trends in payroll
Track payroll changes with visual graphs and indicator arrows comparing data to previous months or years, making trends easy to spot and act on
Retain top talent
Quickly analyze retention metrics with monthly hires, terminations, and turnover data to improve staff satisfaction and retention strategies
Detail on demand
Dive deeper into your data by department or individual employee without running multiple reports, offering insights at every level
Custom reports & analysis
Create custom reports, pivot tables, and graphs to analyze data efficiently, enabling better business decisions faster
Multi-facility view
For clients with multiple FEINs, access cumulative data or view insights by individual company for a tailored approach
Share what matters
Easily export your data to PDF or Excel for further analysis, sharing, or reporting needs
Proven. Trusted. Preferred.

Solutions Tailored to Your Role Lorem
Administrators
Lorem ipsum dolor sit amet consectetur. Vestibulum molestie donec neque pharetra sem porttitor est id pharetra.
CEO
Lorem ipsum dolor sit amet consectetur. Vestibulum molestie donec neque pharetra sem porttitor est id pharetra.
Role/Persona
Lorem ipsum dolor sit amet consectetur. Vestibulum molestie donec neque pharetra sem porttitor est id pharetra.
Role/Persona
Lorem ipsum dolor sit amet consectetur. Vestibulum molestie donec neque pharetra sem porttitor est id pharetra.
"We are now able to do any kind of analysis...we had none before, other than a manual analysis, Viventium’s report builder and reporting capability give us answers to better run our business."

Larry Aronson
Homewatch Caregivers
Explore our entire product suite
Applicant Tracking
Onboarding

HR

Payroll

Benefits Administration

Scheduling

Time & Attendance

ACA Compliance

Business Intelligence

Learning Management

Stay ahead of healthcare compliance
Featured Resources


Based on 1,000+ reviews from